Merino Superior Sires - 2023
Merino Superior Sires (MSS) is a publication that combines the results from Merino sire evaluations run across Australia. The current publication has just been released in both hard copy and can be downloaded from the Merino Superior Sires website.
What information is published in the MSS?
MSS is an annual report for Merino Sire Evaluation, a long running progeny testing program that evaluates the genetic performance of individual Merino sires in a diverse range of environments across Australia (it is not a bloodline comparison).
Sires are joined via artificial insemination to an even line of classed ewes, with the resulting progeny being measured and visually scored for a large number of traits.
Detailed individual site reports will have more detail, however the MSS provides a complete summary of the sires that have been measured over the past 5 years (2018 and 2022 drops).
Top 50 sires
The top 50 ranked sires for the MERINOSELECT current indexes (DP+, MP+, FP+ and WP+) are provided in the hard copy report, more are available on the MSS website. It is pleasing to see many SheepMetriX clients in the top 50.
A key feature of the MSS that is not available anywhere else is the sire TOPs and CULLs.
How to read the TOPs and CULLs
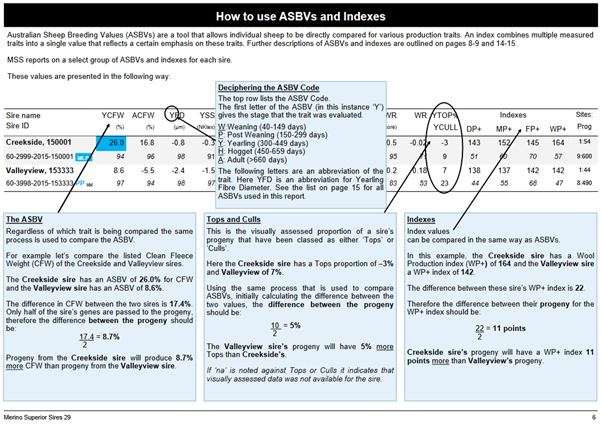
TOPs and CULLs are the visually assessed proportion of a sires progeny that have been classed either a TOP (top 25%), FLOCK (middle 50%) or CULL (bottom 25%). The classing is done by an independent person where all the progeny at the sire evaluation site are classed at the same time using the sites breeding objective. This classing process is done blind, no pedigree information is known by the classer.
Interpreting the TOPs and CULLs
As mentioned, an independent classer grades all the progeny as either TOP, FLOCK or CULL based on a visual assessment against the sites breeding objective. The values for TOPs and CULLs are expressed as deviation from the average of all sire groups.
For example, a sire with 12% TOPS has 12% more top grade progeny than the average sire. As sire with -5% CULLs has 5% less cull grade progeny that the average sire. Ultimately, we are looking for a positive number in the TOPs and a negative number in the CULLs.
This is a good explanation to assist interpreting Australian Sheep Breeding Values (ASBVs), indexes and TOPs and CULLs.
Percentile band table - this is an excellent tool to calibrate yourself when looking at breeding values and indexes - remember the 50th percentile is the average performance across the database. This is the only place you will see the YTOP and YCULL assessments.
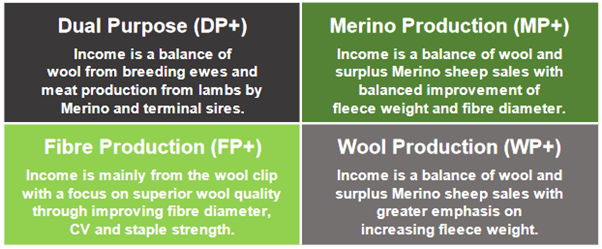
Current MERINOSELECT indexes used in the Merino Superior Sires 2023 report.


